Exploring Airbnb with Charts and Stuff
Following my previous post, here is some exploratory data analysis on what a promising Airbnb property consists of.
Introduction
Airbnb has revolutionized the travel industry by offering unique and affordable accommodations for travelers worldwide. With its popularity, there has been an explosion of Airbnb listings, making it difficult for both hosts and guests to determine the best price for their properties and stays. That’s where exploratory data analysis (EDA) comes in. By analyzing a dataset consisting of data from Airbnb listings in the state of Utah, we can uncover patterns and trends in pricing that can help hosts optimize their rental income and guests find the best deals on their next Airbnb stay. In this blog post, I will perform exploration on the dataset I previously scraped from the Airbnb website. Visit my last blog post if you want to learn more about that process!
On to the charts and stuff
The main focus of my analysis is factors that affect price. With this in mind, I constructed a few different graphs to see if I could identify any strong patterns or correlations. I compared different variables with price and created some scatterplots.
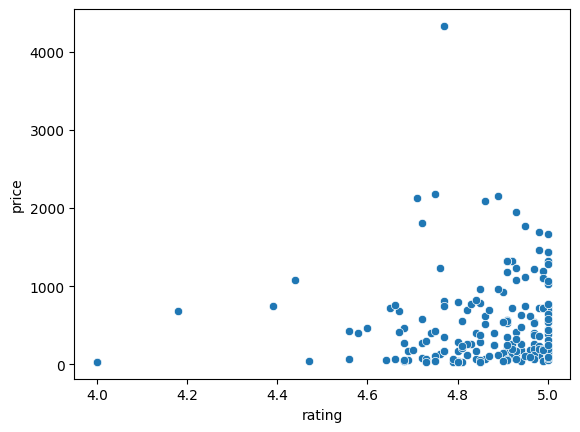
This first one is price versus rating. it seems like there is a positive correlation between the two variables, but there is a wide spread.
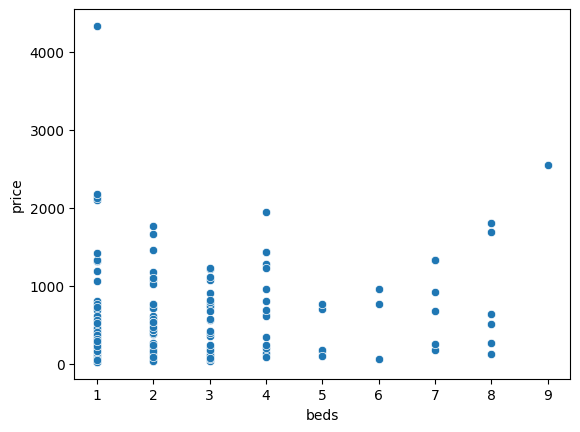
I then compared number of beds with price. Curiously, there doesn’t appear to be a strong relationship. I expected there to be a steady positive correlation between the two, but it seems relatively uniform, especially when there are 1 to 4 beds.
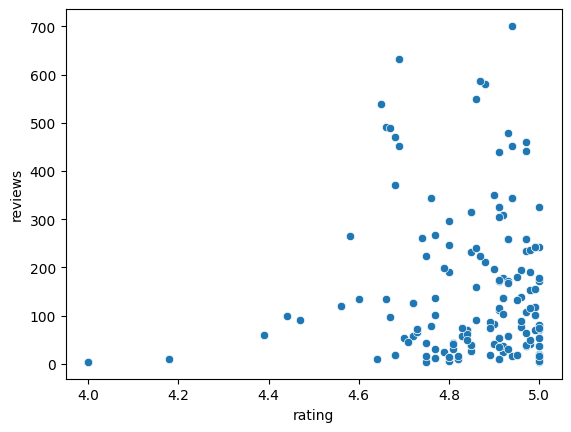
This scatterplot consists of rating scores and number of reviews. I was curious if the number of reviews affected a property’s score, and I was surprised to see that the more reviews, the higher the score.
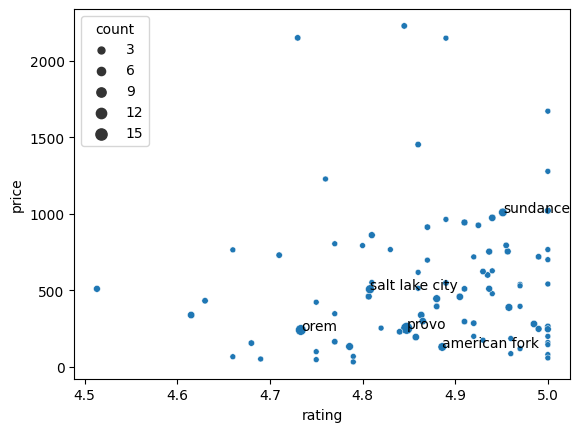
This plot presents an average of ratings and prices by city. The larger the point, the more properties in that city. The cities with six or more properties are labelled.
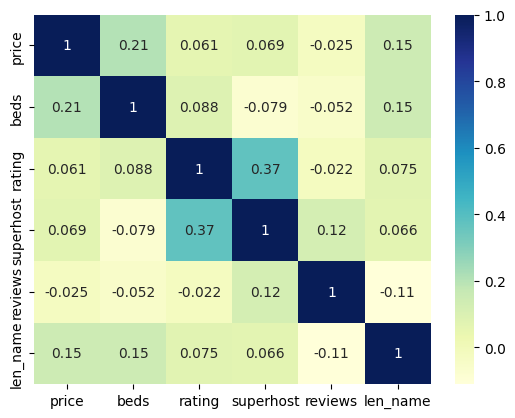
Overall, there doesn’t seem to be much of a relationship between price and many other variables. Here is a correlation heatmap that shows that not much appears to be statistically significant when it comes to price.
Conclusion
Based on this exploratory analysis, a data story is starting to emerge, detailing helpful trends relating to both prospective property owners and renters alike. The next step is piecing it together in a cohesive way in order to utilize the provided information effectively. In my next post, I will be compiling all of my discoveries for a final analysis. Make sure to check back in a couple weeks to see the results!
Link to repository
Here is a link to the Airbnb repository!